Page load performance should be every company’s #1 priority with regard to its website – if your website is slow, it will affect all the KPIs that outrank it. Several years ago, I worked on a project at salesforce.com to improve page load time, starting with the homepage and all the lead capture forms you could reach from the homepage. Over the course of several months, we refactored our server-side code to run and respond faster, but my primary responsibility was to optimize the front-end JavaScript on our pages. This was in the early days of tag management, and we weren’t ready to invest in such a solution – so I began sifting through templates, compiling lists of all the 3rd-party tags that had been ignored for years, talking to marketers to find out which of those tags they still needed, and then breaking them down to their nitty-gritty details to consolidate them and move them into a single JavaScript library that would do everything we needed from a single place, but do it much faster. In essence, it was a non-productized, “mini” tag management system.
Within 24 hours of pushing the entire project live, we realized it had been a massive success. The difference was so noticeable that we could tell the difference without having all the data to back it up – but the data eventually told us the exact same story. Our monitoring tool was telling us our homepage was loading nearly 50% faster than before, and even just looking in Adobe at our form completion rate (leads were our lifeblood), we could see a dramatic improvement. Our data proved everything we had told people – a faster website couldn’t help but get us more leads. We hadn’t added tags – we had removed them. We hadn’t engaged more vendors to help us generate traffic – we were working with exactly the same vendors as before. And in spite of some of the marketing folks being initially hesitant about taking on a project that didn’t seem to have a ton of business value, we probably did more to benefit the business than any single project during the 3 1/2 years I worked there.
Not every project will yield such dramatic results – our page load performance was poor enough that we had left ourselves a lot of low-hanging fruit. But the point is that every company should care about how their website performs. At some point, almost every client I work with asks me some variation of the following question: “How can I measure page load time with my analytics tool?” My response to this question – following a cringe – is almost always, “You really can’t – you should be using another tool for that type of analysis.” Before you stop reading because yet another tool is out of the question, note that later on in this post I’ll discuss how your analytics tool can help you with some of the basics. But I think it’s important to at least acknowledge that the basics are really all those tools are capable of.
Even after several years of hearing this question – and several enhancements both to browser technology and the analytics tools themselves – I still believe that additional tools are required for robust page load time measurement. Any company that relies on their website as a major source of revenue, leads, or even just brand awareness has to invest in the very best technologies to help that website be as efficient as possible. That means an investment not just in analytics and optimization tools, but performance and monitoring tools as well. At salesforce.com, we used Gomez – but there are plenty of other good services as well that can be used on a small or large scale. Gomez and Keynote both simulate traffic to your site using any several different test criteria like your users’ location, browser, and connection speed. Other tools like SOASTA actually involve real user testing along some of the same dimensions. Any of these tools are much more robust than some of the general insight you might glean from your web analytics tool – they provide waterfall breakdowns and allow you to isolate where your problems come from and not just that they exist. You may find that your page load troubles only occur at certain times of the day or in certain parts of the world, or that they are happening in a particular leg of the journey. Maybe it’s a specific third-party tag or a JavaScript error that you can easily fix. In any case, these are the types of problems your web analytics tool will struggle to help you solve. The data provided by these additional tools is just much more actionable and helpful in identifying and solving problems.
The biggest problem I’ve found in getting companies to adopt these types of tools is often more administrative than anything. Should marketing or IT manage the tool? Typically, IT is better positioned to make use of the data and act on it to make improvements, but marketing may have a larger budget. In a lot of ways, the struggles are similar to those many of my clients encounter when selecting and implementing a tag management system. So you might find that you can take the learnings you gleaned from similar “battles” to make it easier this time. Better yet, you might even find that one team within your company already has a license you can use, or that you can team up to share the cost. However, if your company isn’t quite ready yet to leverage a dedicated tool, or you’re sorting through red tape and business processes that are slowing things down, let’s discuss some things you can do to get some basic reporting on page load time using the tools you’re already familiar with.
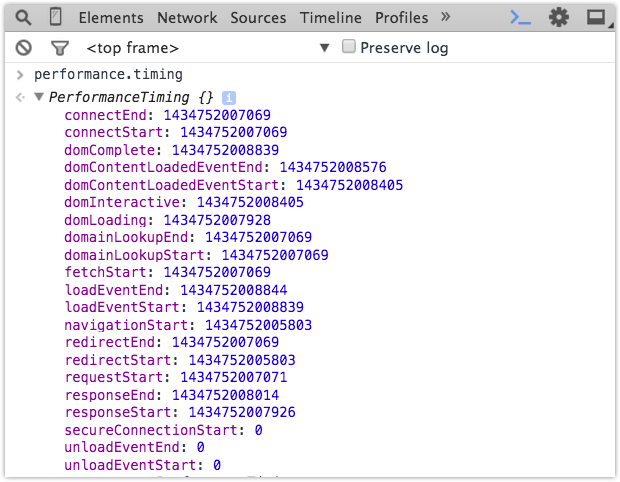
Anything you do within your analytics tool will likely be based on the browser’s built-in “timing” object. I’m ashamed to admit that up until recently I didn’t even realize this existed – but most browsers provide a built-in object that provides timestamps of the key milestone events of just about every part of a page’s lifecycle. The object is simply called “performance.timing” and can be accessed from any browser’s console. Here are some of the useful milestones you can choose from:
- redirectStart and redirectEnd: If your site uses a lot of redirects, it could definitely be useful to include that in your page load time calculation. I’ve only seen these values populated in rare cases – but they’re worth considering.
- fetchStart: This marks the time when the browser first starts the process of loading the next page.
- requestStart: This marks the time when the browser requests the next page, either from a remote server or from its local cache.
- responseEnd: This marks the time when the browser downloads the last byte of the page, but before the page is actually loaded into the DOM for the user.
- domLoading: This marks the time when the browser starts loading the page into the DOM.
- domInteractive: This marks the time when enough of the page has loaded for the user to begin interacting with it.
- domContentLoaded: This marks the time when all HTML and CSS are parsed into the DOM. If you’re familiar with jQuery, this is basically the same as jQuery’s “ready” event (“ready” does a bit more, but it’s close enough).
- domComplete: This marks the time when all images, iframes, and other resources are loaded into the DOM.
- loadEventStart and loadEventEnd: These mean that the window’s “onload” event has started (and completed), and indicate that the page is finally, officially loaded.
There are many other timestamps available as part of the “performance” object – these are only the ones that you’re most likely to be interested in. But you can see how it’s important to know which of these timestamps correspond to the different reports you may have in your analytics tool, because they mean different things. If your page load time is measured by the “loadEventEnd” event, the data probably says your site loads at least a few hundred milliseconds slower than it actually appears to your users.
The major limitation to using JavaScript timing is exactly what you’d expect: cross-browser compatibility. While IE8 is (finally!) a dying browser, it has not historically been the only one to lack support – mobile Safari has been a laggard as well as well. However, as of late 2015, iOS now supports this feature. Since concern for page load time is even more important for mobile web traffic, and since iOS is still the leader in mobile traffic for most websites, this closes what has historically been a pretty big gap. When you do encounter an older browser, the only way to fill this gap accurately for browsers lacking timing support is to have your development team write its own timestamp as soon as the server starts building the page. Then you can create a second timestamp when your tags fire, subtract the difference, and get pretty close to what you’re looking for. This gets a bit tricky, though, if the server timezone is different than the browser timezone – you’ll need to make sure that both timestamps are always in the same timezone.
This functionality is actually the foundation of both Adobe Analytics’ getLoadTime plugin and Google Analytics’ Site Speed reports. Both have been available for years, and I’ve been suspicious of them since I first saw them. The data they provide is generally sound, but there are a few things to be aware of if you’re going to use them – beyond just the lack of browser support I described earlier.
Adobe’s getLoadTime Plugin
Adobe calculates the start time using the most accurate start time available: either the browser’s “requestStart” time or a timestamp they ask you to add to the top of the page for older browsers. This fallback timestamp is unfortunately not very accurate – it doesn’t indicate server time, it’s just the time when the browser got to that point in loading the page. That’s likely to be at least a second or two later than when the whole process started, and is going to make your page load time look artificially fast. The end time is when the tag loads – not when the DOM is ready or the page is ready for user interaction.
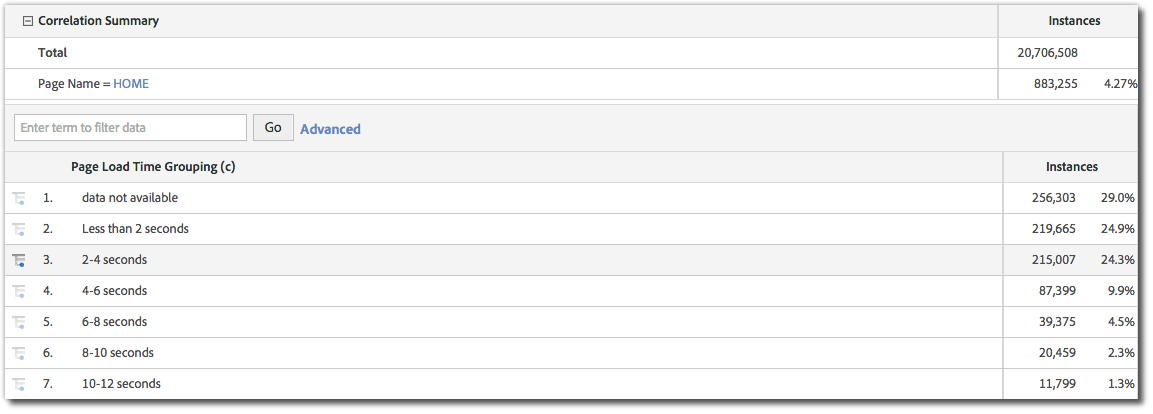
When the visitor’s browser is a modern one supporting built-in performance timing, the data provided by Adobe is presented as a series of numbers (in milliseconds) that the page took to “load.” That number can be classified into high-level groups, and it can be correlated to your Pages report to see which pages load fastest (or slowest). Or you can put that number into a custom event that can be used in calculated metrics to measure the average time a given page takes to load.
Google’s Site Speed Reports
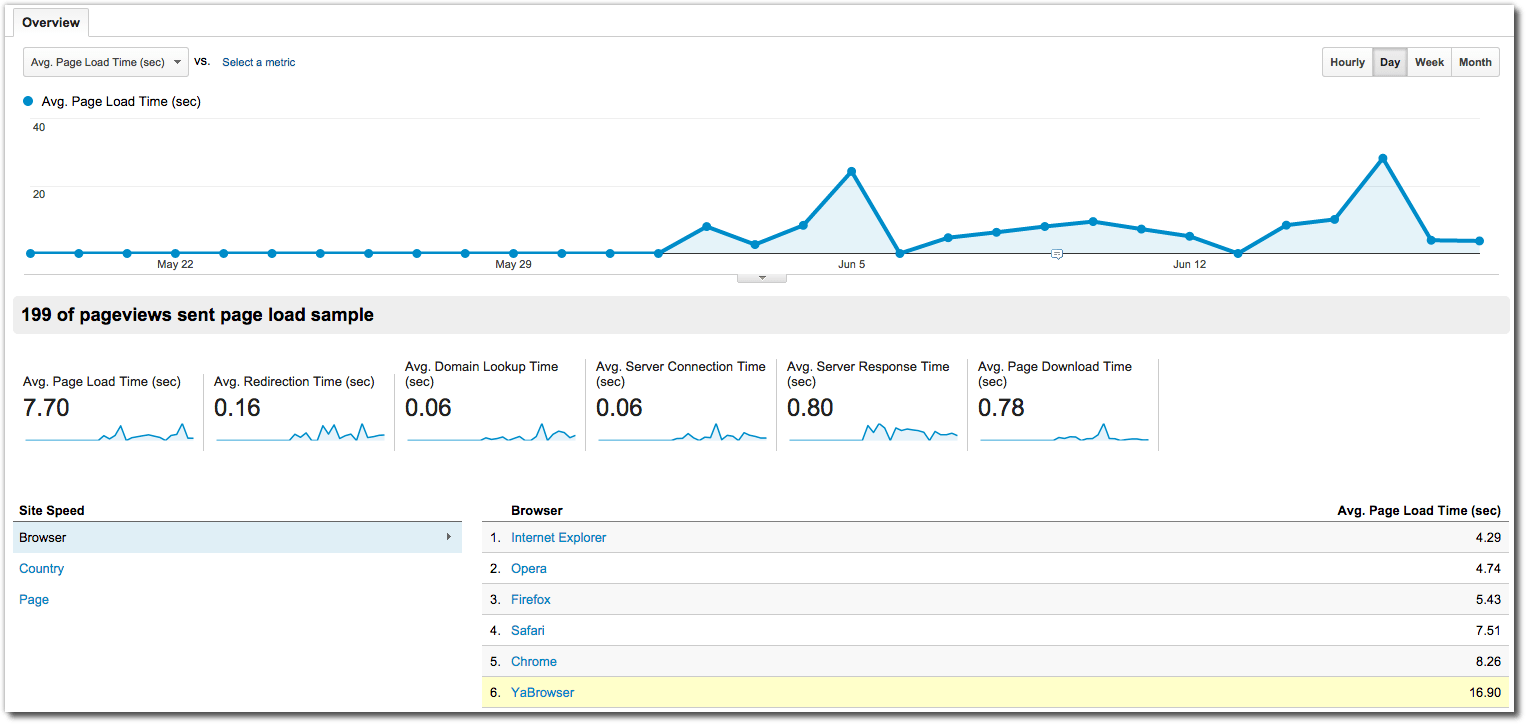
Google’s reports, on the other hand, don’t have any suspect handling of older browsers – the documentation specifically states that the reports only work for browsers that support the native performance timing object. But Google’s reports are averages based on a sampling pool of only 1% of your visitors (which can be increased) – but you can see how a single visitor making it into that small sample from a far-flung part of the world could have a dramatic impact on the data Google reports back to you. Google’s reports do have the bonus of taking into account many other timing metrics the browser collects besides just the very generic interpretation of load time that Adobe’s plugin offers.
As you can see, neither tool is without its flaws – and neither is very flexible in giving you control over which time metrics their data is based on. If you’re using Adobe’s plugin, you might have some misgivings about their method of calculation – and if you’re using Google’s standard reports, that sampling has likely led you to cast a suspicious eye on those reports when you’ve used them in the past. So what do you do if you need more than that? The only real answer is to take matters into your own hands. But don’t worry – the actual code is relatively simple and can be implemented with minimal development effort, and it can be done right in your tag management system of choice. Below is a quick little code snippet you can use as a jumping-off point to capture the page load time on each page of your website using built-in JavaScript timing.
	function getPageLoadTime() {
		if (typeof(performance) !== 'undefined' && typeof(performance.timing) == 'object') {
			var timing = performance.timing;

			// fall back to less accurate milestones
			var startTime = performance.timing.redirectStart ||
					performance.timing.fetchStart ||
					performance.timing.requestStart;
			var endTime = performance.timing.domContentLoadedEventEnd ||
					performance.timing.domInteractive ||
					performance.timing.domComplete ||
					performance.timing.loadEventEnd;

			if (startTime && endTime && (startTime < endTime)) {
				return (endTime - startTime);
			}
		}

		return 'data not available';
	}
You don’t have to use this code exactly as I’ve written it – but hopefully it shows you that you have a lot of options to do some quick page load time analysis, and you can come up with a formula that works best for your own site. You (or your developers) can build on this code pretty quickly if you want to focus on different timing events or add in some basic support for browsers that don’t support this cool functionality. And it’s flexible enough to allow you to decide whether you’ll use a dimensions/variables or metrics/events to collect this data (I’d recommend both).
In conclusion, there are some amazing things you can do with modern browsers’ built-in JavaScript timing functionality, and you should do all you can to take advantage of what it offers – but always keep in mind that there are limitations to this approach. Even though additional tools that offer dedicated monitoring services carry an additional cost, they are equipped to encompass the entire page request lifespan and can provide much more actionable data. Analytics tools allow you to scratch the surface and identify that problems exist with your page load time – but they will always have a difficult time identifying what those problems are and how to solve them. The benefit of such tools can often be felt across many different groups within your organization – and sometimes the extra cost can be shared the same way. Page load time is an important part of any company’s digital measurement strategy – and it should involve multiple tools and collaboration within your organization.
Photo Credit: cod_gabriel (Flickr)