Today I am happy to share a guest post from one of our “Team Demystified” superstars, Melody Walk! Melody has been with us for years and is part of Adam Greco’s Adobe Analytics Experts Council where she will be sharing this metric with other experts. We asked her to share more detail here and if you have questions you can write me directly and I will connect you with Melody.
It’s often helpful to use Adobe Analysis Workspace to analyze A/B test results, whether it’s because you’re using a hard-coded method of online testing or you want to supplement your testing tool results with more complex segmentation. In any case, Analysis Workspace can be a great tool for digging deeper into your test results. While Workspace makes calculating lift in conversion rate easy with the summary change visualization, it can be frustrating to repeatedly plug your data into a confidence calculator to determine if your test has reached statistical significance. The calculated metric I’m sharing in this post should help alleviate some of that frustration, as it will allow you to display statistical confidence within Analysis Workspace just as you would lift. This is extremely helpful if you have business stakeholders relying on your Workspace to regularly check in on the test results throughout the life of the test.
This calculated metric is based on the percent confidence formula for a two-tailed T-Test. Below is the formula, formatted for the Adobe Calculated Metric Builder, and a screen shot of the builder summary.

The metric summary can be difficult to digest, so I’ve also included a screen shot of the metric builder definition at the end of this post. To create your confidence calculated metric you’ll need unique visitor counts and conversion rates for both the control experience (experience A) and the test experience (experience B). Once you’ve built the metric, you can edit it for all future tests by replacing your experience-specific segments and conversion rates, rather than starting from scratch each time. I recommend validating the metric the first several times you use it to confirm it’s working as expected. You can do so by checking your percent confidence against another calculator, such as the Target Complete Confidence Calculator.
Here are some things to keep in mind as you build and use this metric:
- Format your confidence calculated metric as a percent (number of decimals is up to you).
- You’ll need to create a separate confidence calculated metric for each experience compared to the control and for each success event you wish to measure. For example, if your test has a control and two challenger experiences and you’re measuring success for three different events, you’ll need to create six confidence metrics.
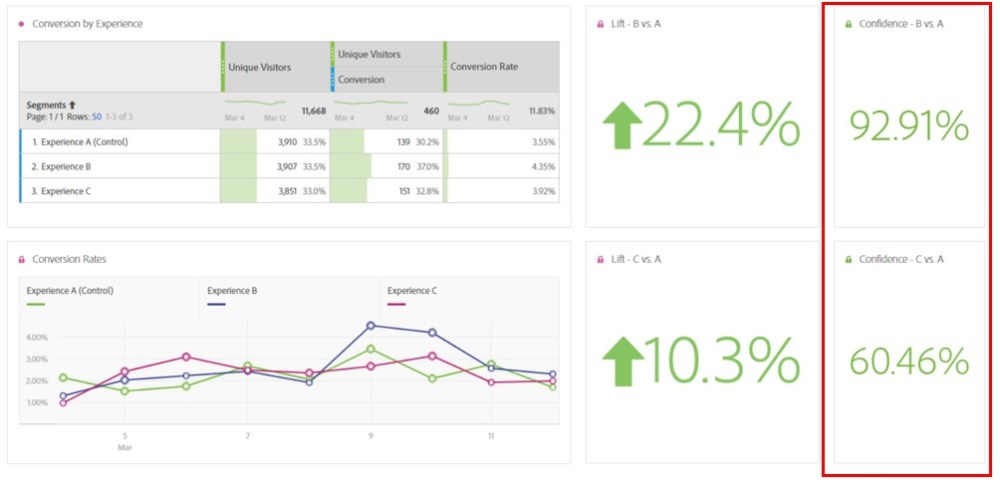
- Add your confidence metric(s) to a separate free-form table with a universal dimension, a dimension that is not specific to an individual experience and applies to your entire test period. Then, create summary number visualizations from your confidence metrics per the example below.

- This formula only works for calculating confidence with binary metrics. It will not work for calculating confidence with revenue or AOV.
After creating your confidence metrics you’ll be able to cleanly and easily display the results of your A/B test in Analysis Workspace, helping you save time from entering your data in an external calculator and helping your stakeholders quickly view the status of the test. I hope this is as helpful for you as it has been to me!
Calculated Metric Builder Definition
