Analytics Strategy

A Framework for Digital Analytics Process

Digital Analytics process can be used to accomplish many things. Yet, in it’s most valuable form, process should be viewed as a means to familiarize business users with data that is potentially available to them and to create efficiency around how that data is collected, analyzed, and provided back to the business.

Most organizations have organic processes that grew out of necessity, but in my experience few have developed formal process for taking in analytics requests, for data quality management, or for new tagging requests. While each of these activities usually happens at organizations today, they are largely handled through ad hoc processes that fail to provide consistency or efficient delivery. As such, Analytics Demystified recommends that companies implement a process framework that will address each of these critical components.

Note that the introduction of a new process into a business environment requires a change in habits and routines. While our process recommendations seek to minimize disruption to everyday operations, some new ways of collaborating will be required. Analytics Demystified’s recommended processes are designed to be minimally invasive, but we recognize that change management may be required to introduce new process to the business and to illustrate the business benefits of using process to expedite analytics.

Digital Analytics New Request Tagging & QA Process

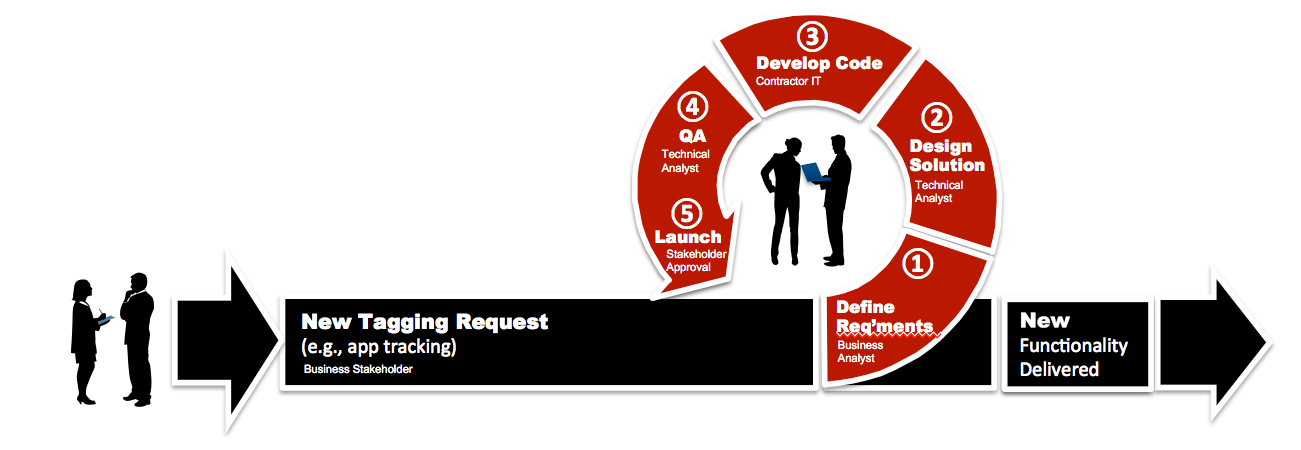
This process is designed using a Scrum methodology, which can easily fit within most companies development cycles. At the conceptual level, the Analytics Tagging & QA Process provides a method for business users to communicate their data needs, which are then used to: 1) Define requirements, 2) Create a Solution Design, 3) Develop Analytics Code, 4) Conduct QA, and 5) Launch new tracking functionality (see diagram below).

Analytics Process

Tagging & QA Process — Starting Point:

The tagging and QA Process is one that is typically used by organizations multiple times throughout website redesigns, feature/function improvements, and general updates. It is intended to be a scalable process so that it can be used for all future feature and development projects that require analytics as well as digital analytics analysis requests.

The starting point for this process includes a “Digital Analytics Brief” that will be used to identify goals, measurement objectives, and specific elements that need to be tracked with analytics. We recommend using a simple Word, Excel or Google Doc document to capture information such as: Requestor, Request Date, Due Date, Priority: (Low, Medium, High), Overview: (brief description of request), Primary Objective: (What are you trying to achieve?), Desired Outcome: (How do we know if we’re successful?), and Additional Comments. Using a brief will force business users to think through what they’re asking for and to clearly define the objectives and desired outcomes. These two components are critical to determining success factors and formulating KPIs.  

A Digital Analytics Brief can be expanded over time or developed as an online questionnaire that feeds a centralized management tool as companies increase their sophistication with the Tagging & QA Process. Yet, either simplistic or automated, using this a Brief format as the first step in the data collection process will enable the digital analytics team to assign resources to projects and prioritize them accordingly. This will also serve to get business users accustomed to thinking about tracking and analytics early in their development projects to ensure tagging will be incorporated into development cycles.

Step 1: Defining Business Requirements

With the Digital Analytics Brief in hand, the business analyst should have pertinent information necessary to begin the process of defining  business requirements. Depending on the scope of the project, this part of the process should take between one and five hours to complete with the Digital Analyst leading the effort and stakeholders collaborating with details. Demystified recommends using a template for collecting business requirements that captures each requirement as a business question. (See Bulletproof Business Requirements for more details).

One of the things that we’ve learned in our years of experience working with digital analytics, is that business-users are rarely able to articulate their analytics requirements in a manner that can be easily translated into measuring website effectiveness. Simply asking these users what data they need leads to insufficient information and gaps in most web analytics deployments. As such, Analytics Demystified developed a process designed to gather information necessary to consistently evaluate the effectiveness of our clients fixed web, mobile sites, mobile apps and other digital assets.

By using a similar process, you too can effectively identify requirements and document them using a format ready for translation into a Solution Design document.

BusinessRequirements_screenshot

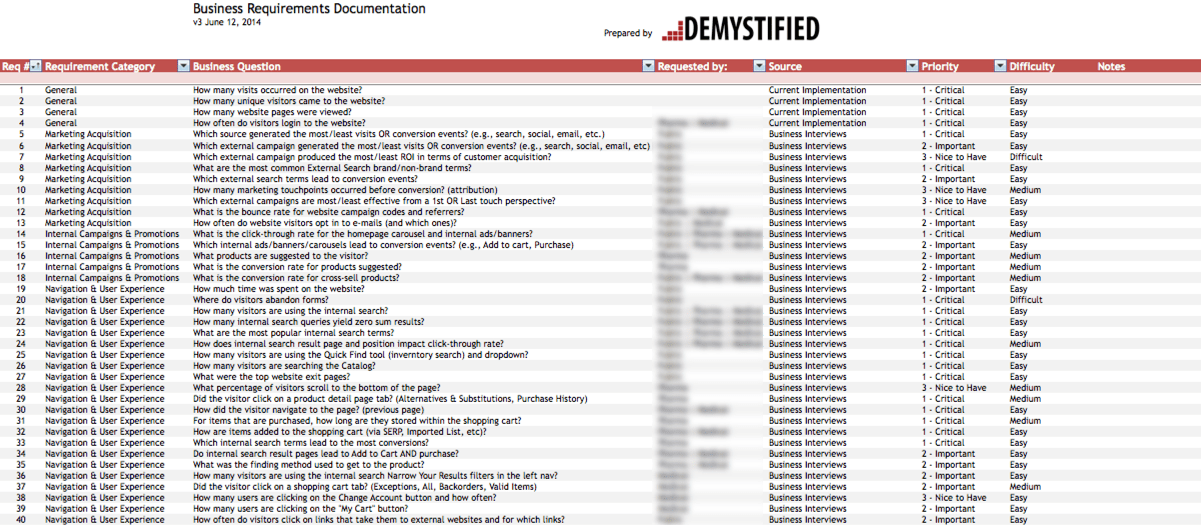
Example Business Requirements Documentation

Step 2: Creating A Solution Design

Often one of the most important yet overlooked aspects of digital analytics is documentation. Documentation provides an organization the ability to clearly define and record key components of its digital analytics implementation. At Analytics Demystified, we recommend starting the documentation using Excel as the format and expanding with additional worksheets as the requirements, Solution Design, and other components (e.g., QA processes) evolve.

Companies can rely on internal resources to generate documentation, or if using an agency or consulting partner, ask them to provide documentation  that should serve as the foundation for your analytics implementation. At Analytics Demystified we typically generate a Solution Design as part of our engagements and require that employees on the Digital Analytics team intimately familiar with this document because it will serve to answer all questions about data availability from the analytics platform.

Solution_Design_screenshot

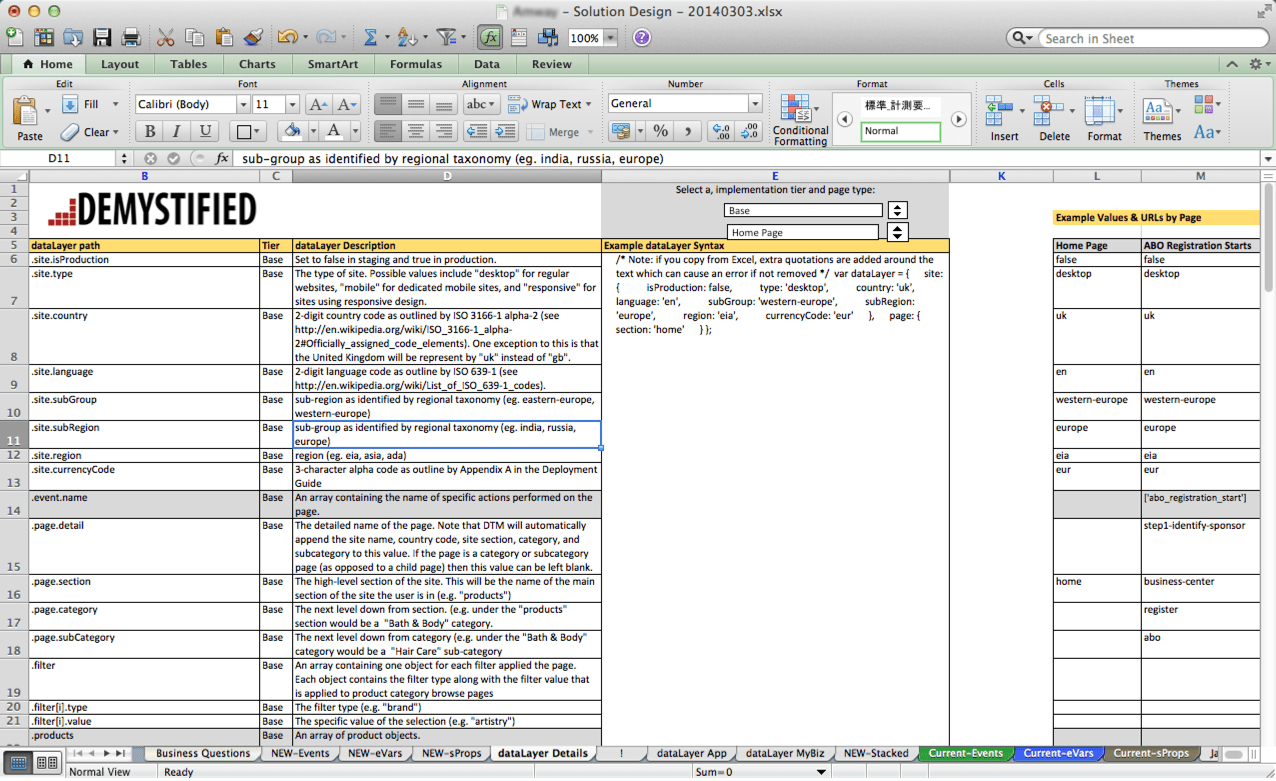
Example Solution Design Documentation

Step 3: Developing Code

Unlike traditional development, digital analytics (especially Adobe Analytics) requires its own specific code base that includes events, eVars, and sProps to work properly. Most often we see clients outsourcing the development of code to external consultants who are experts in these specific technologies as this technical component of the job is often lacking within an organization’s core competency. However, in the long-term employing a Technical Digital Analyst with experience developing code for SiteCatalyst would position the company for self sufficiency.

Also, in the event that Tag Management Solutions are employed, a Data Layer is required to make appropriate information available to the digital analytics solution, which should also be addressed during the coding stage.

Step 4: QA

As with all development projects, digital analytics requires QA testing to ensure that tags are implemented correctly and that data appears within the interface as expected. At Analytics Demystified, we have developed our own processes for administering QA on digital analytics tags. Because QA requires input from technical analysts and IT developers, the process is typically managed via shared documentation (we use Google Docs) that can be accessed and modified by multiple parties.

Beginning with a QA Overview, companies should identify QA environments and Build environments with associated details on the platform (e.g., desktop, mobile, etc) as well as the number of variables to be tested. It is also helpful to develop a QA schedule to ensure that all testing is completed within development cycles and that both Technical Analysts and IT Developers are aware of the timelines for QA testing. Additionally, using a ticketing system will help Technical Analysts to manage what needs to be addressed and where issues are encountered during the QA process. The very nature of QA requires back-and-forth between parties and managing these interactions using a shared spreadsheet enables all parties to remain in synch and for work to get assigned and accomplished as planned.

Step 5: User Acceptance & Launch

Once the code has been QA’ed by the technical analytics team, it moves through the process workflow back to the business user who requested the tagging for final approval. While this part of the process should be managed by the Analytics Technical staff, it’s incumbent upon the business user to sign off on the tagging such that the data they will receive will help them not only measure the digital asset, but also make decisions on how to improve and optimize the asset.

A best practice at this stage would be for the digital analytics team to provide example reports so that the business user knows exactly what data they will receive and in what format. However, due to time constraints with development projects this isn’t always possible. In these cases, simply showcasing the prioritized requirements and the expected output should be sufficient to showcase what the data will look like in the production environment.

In closing, there are many different processes that can (and should) be applied to digital analytics. By building process around mission critical tasks, businesses can create efficiency in the way they work and bring new levels of standards and accountability to staff. By creating a process for new analytics requests, we’ve witnessed that organizations become more skilled at deploying tagging and reports in a timely manner with fewer defects.

Now it’s your turn…do you use a process for analytics? I’d love to hear how yours works.

Analysis

QA: It's for Analysts, Too (and I'm not talking about tagging)

There is not an analyst on the planet with more than a couple of weeks of experience who has not delivered an analysis that is flawed due to a mistake he made in pulling or analyzing the data. I’m not talking about messy or incomplete data. I’m talking about that sinking feeling when, following your delivery of analysis results, someone-somewhere-somehow points out that you made a mistake.

Now, it’s been a while since I experienced that feeling for something I had produced. <Hold on for a second while I find a piece of wood to knock on… Okay. I’m back.> I think that’s because it’s an ugly enough feeling that I’ve developed techniques to minimize the chance that I experience it!

As a blogger…I now feel compelled to write those down.

I get it. There is a strong urge to skip QA’ing your analysis!

No one truly enjoys quality assurance work. Just look at the number of bugs that QA teams find that would have easily been caught in proper unit testing by the developer. Or, for that matter, look at the number of typos that occur in blog posts (proofreading is a form of QA).

Analysis QA isn’t sexy or exciting work (although it can be mildly stimulating), and, when under the gun to “get an answer,” it can be tempting to hasten to the finish by skipping past a step of QA, but it’s not a wise step to skip.<

I mean it.  Skipping Analysis QA is bad, bad, BAD!

9 times out of 10, QA’ing my own analysis yields “nothing” – the data I pulled and the way I crunched it holds up to a second level of scrutiny. But, that’s a “nothing” in quotes because “9 times everything checked out” is the wrong perspective. That one time in ten when I catch something pays for itself and the other nine analyses many times over.

You see, there are two costs of pushing out the results of an analysis that have errors in them:

doh

  1. It can lead to a bad business decision. And, once an analysis is presented or delivered, it is almost impossible to truly “take it back.” Especially if that (flawed) analysis represents something wonderful and exciting, or if it makes a strong case for a particular viewpoint, it will not go away. It will sit in inboxes, on shared drives, and in printouts just waiting to be erroneously presented as a truth days and weeks after the error was discovered and the analysis was retracted.
  2. It undermines the credibility of the analyst (or, even worse, the entire analytics team). It takes 20 pristine analyses* that hold up to rigorous scrutiny to recover the trust lost when a single erroneous analysis is delivered. This is fair! If the marketer makes a decision  (or advocates for a decision) based on bad data from the analyst, they wind up taking bullets on your behalf.

Analysis QA is important!

With that lengthy preamble, below are my four strategies for QA’ing my own analysis work before it goes out the door.

1. Plausibility Check

Like it or not, most analyses don’t turn up wildly surprising and dramatic insights. When they do – or, when they appear to – my immediate reaction is one of deep suspicion.

My favorite anecdote on this front goes back almost a decade, when a product marcom who had been digging into SEO and making tweaks to his product line’s main landing page, popped his head into my cubicle one day and asked me if I’d seen “what he’d done.” He’d been making minor — and appropriate — updates to his product line’s main landing page to try to improve the SEO. When he looked at a traffic report for the page, he saw a sudden and dramatic increase in visits starting one day in the middle of the prior month. He immediately took a printout of the traffic chart and told everyone he could find — including the VP of marketing — that he’d achieved a massive and dramatic success by updating some meta data and page copy!

Of course…he hadn’t.

I dug into the data and pretty quickly found that a Gomez (uptime/load time monitoring software) user agent was the source of the increased traffic. It turned out that Gomez was pitching my company’s web admins, and they’d turned on a couple of monitors to have data to show to the people in the company to whom they were pitching. (The way their monitors worked, each check of the site recorded a new visit, and none of those monitors were filtered out as bots…until I discovered the issue and updated our bots configuration.)
In other words, “Doh!!!”

That’s a dramatic example, but, to adjust the “if it seems too good to be true…” axiom:

If the data looks too surprising or too counter intuitive to be true…it probably is!

Considering the plausibility of the results is not, in and of itself, actual QA, but it’s a way to get the hairs on your back standing up to help you focus on the other QA strategies!

2. Proofread

Proofreading is tedious in writing, and it’s not much less tedious in analytics. But, it’s valuable!

looklfet

Here’s how I proofread my analyses for QA purposes:

  • I pull up each query and segment in the tool I created it in and literally walk back through what’s included.
  • I re-pull the data using those queries/segments and do a spot-check comparison with wherever I wound up putting the data to do the analysis
  • I actually proofread the analysis report – no need to have poor grammar, typos, or inadvertently backwards labeling.

That’s really all there is to it for proofreading. It takes some conscious thought and focus, but it’s worth the effort.

3. Triangulation

This is one of my favorite – and most reliable – techniques. When it comes to digital data and the increasing flexibility of digital analytics platforms, there are almost always multiple ways to come at any given analysis. Some examples:

  • In Google Analytics, you looked at the Ecommerce tab in an events report to check the Ecommerce conversion rate for visits that fired a specific event. To check the data, build a quick segment for visits based on that event and check the overall Ecommerce conversion rate for that segment. It should be pretty close!
  • In SiteCatalyst, you have a prop and an eVar populated with the same value, and you are looking at products ordered by subrelating the eVar with Products and using Orders as the metric. For a few of the eVar values, build a Visit-container-based segment using the prop value and then look at the Products report. The numbers should be pretty close.
  • If you’ve used the eCommerce conversion rate for a certain timeframe in your analysis, pull the visits by day and the orders by day for that timeframe, add them both up, and divide to see if you get the same conversion rate.
  • Use flow visualization (Google Analytics) or pathing (SiteCatalyst) to compare results that you see in a funnel or fallout report – they won’t match, but you should be able to easily explain why when the steps when they differ.
  • Pull up a clickmap to see what it reports when you’ve got a specific link tracked as an event (GA) or a custom link (SiteCatalyst).
  • If you have a specific internal link tracked as an event or custom link, compare the totals for that event to the value from the Previous Page report for the page it links to.

You get the idea. These are all web analytics examples, but the same approach applies for other types of digital analysis as well (if your Twitter analytics platform says there were 247 tweets yesterday that included a certain keyword, go to search.twitter.com, search for the term, and see how many tweets you get back).

triangulation

Quite often, the initial triangulation will turn up wildly different results. That will force you to stop and think about why, which, most of the time, will result in you realizing why that wasn’t the primary way you chose to access the data. The more ass-backwards of a triangulation that you can come up with to get to a similar result, the more confidence you will have that your data is solid (and, when a business user decides to pull the data themselves to check your work and gets wildly different results, you may already be armed to explain exactly why…because that was your triangulation technique!).

4. Phone a friend

Granted, for this one, you have to tap into other resources. But, a fresh set of eyes is invaluable (there’s a reason that development teams generally split developers out from the QA team, and there’s a reason that even professional writers have an editor review their work).

phone a friend

When phoning a friend, you actually can request any or all of the three prior tips:

  • Ask them if the results you are seeing pass the “sniff test” – do they seem plausible?
  • Ask them to look at the actual segment or query definitions you used – get them to proofread your work.
  • Ask them to spot-check your work by trying to recreate the results – this may or may not be triangulation (even if they approach the question exactly as you did, they’re still checking your work).

To be clear, you’re not asking that they completely replicate your analysis. Rather, you’re handing them a proverbial napkin and asking them to quickly and messily put a pen to that napkin to see if anything emerges that calls your analysis into question.

This Is Not As Time-Consuming As It Sounds

I positively cringe when someone excitedly tells me that they “just looked at the data and saw something really interesting!”

  • If it’s a business user, I shake my head and gently probe for details (“Really? That’s interesting. Let me see if I’m seeing the same thing. How is it that you got this data?…”)
  • If it’s an analyst, I say a silent prayer that they really have found something really interesting that holds up as interesting under deeper scrutiny. The more surprising and powerful the result, the stronger I push for a deep breath and a second look.

So, obviously, there is a lot of judgment involved when it comes to determining the extent of QA to perform. The more complex the project, and the more surprising the results, the more time it’s worth investing in QA. The more you get used to doing QA, the earlier in the analysis you will be thinking about it (and doing it), and the less incremental time it takes.

And it’s worth it.

Photos courtesy of, in order, hobvias sudoneighm, Terry Whalebone, Nate Steiner, and Bùi Linh Ngân.

*Yup. I totally made that number up…but it feels about right based on my own experience.